


- Research & Evidence
- Case Studies
- Make Happen Impact on Key Stage 4 Attainment
At HEAT, we do not only track students into the Higher Education Statistics Agency (HESA) to learn their HE progression outcomes, but also the National Pupil Database (NPD), to obtain Key Stage 4 (GCSE) and Key Stage 5 (A-level/BTEC) exam outcomes.
Every year, HEAT members receive a dataset showing the Key Stage 4 (KS4) exam performance of all participants who engaged in outreach before sitting their GCSE exams. Just in case this has been missed, members can access their Key Stage 4 Attainment Track dataset in the File Store and attach it to HEAT’s Dashboard (members only) to visualise the results.
Key Stage 4 attainment has been shown as critical to future HE progression. National research shows that attainment at this point explains nearly all of the social stratification in later higher education (HE) progression (Crawford, 2014). Owing to this finding, the Office for Students (OfS) now require universities to provide evidence in their Access and Participation Plans of how they are raising pre-entry attainment in schools.
HEAT Aggregate Research shows that participation in pre-16 outreach appears to have a positive impact on attainment at KS4. This remains true after controlling for prior attainment at Key Stage 2 (exams taken at the end of primary school) and Free School Meal (FSM) eligibility. Although this is a promising overall finding, to enhance learning about what boosts attainment, we also support members to evaluate specific activities using these same tracking data.
A Practical Example
To demonstrate the potential evidence that is possible to generate from HEAT’s KS4 Attainment Tracking Datasets and Dashboards, the following reports on a real life example belonging to the Uni Connect Partnership Make Happen. This process is possible for any HEAT member with participant data in the latest KS4 tracking report.
Make Happen were keen to understand whether two of their pre-16 activities had an impact on participants’ KS4 exam attainment. These activities were run in partnership with two external providers. First, Fix Up who offer a range of sessions related to providing support with motivation and exam preparation. Second, Positively Mad who run whole day workshops in schools focused on exam and revision skills.
First, Make Happen identified the participants they wanted to include in two separate KS4 attainment activity evaluations. Make Happen were careful to include only those participants who had attended and received above a threshold contact hours of two and three hours for each activity respectively. Programme Titles were created for these Activities, and selected participants were registered to them, ensuring they were marked as ‘Participants’ using the Evaluation Group field.
Although both activities have an attainment-raising component, they were not tutoring activities but rather more general motivational activities. Although the link between raising motivation and attainment is debated (Cummings et al., 2012; Gorard and See, 2013), clear theories of change were developed (something which is possible for all members to do in HEAT’s Evaluation Plans Tool (members only)) and evaluators felt confident that the activities in question provided a theoretically sound mechanism to improve participants’ attainment.
The results showed that, for Fix Up participants (n=165) Attainment 8 Scores were on average +6.1 grades higher than the average scores for the schools they came from. This remained true after breaking down by prior attainment at Key Stage 2: participants with low prior attainment (n=20) demonstrated the greatest positive difference, achieving on average +5.7 grades higher across eight GCSEs than their similarly low attaining classmates.

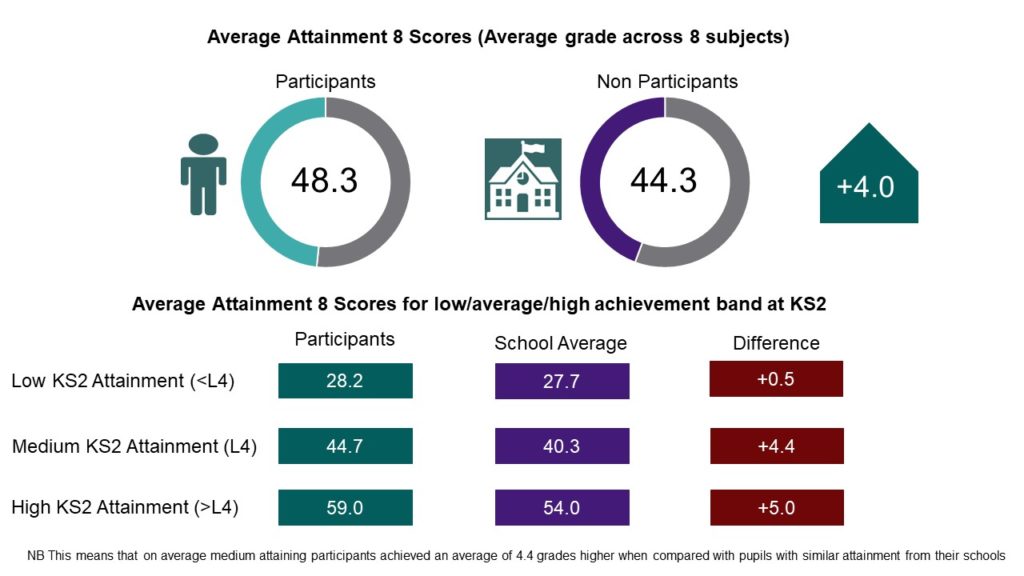
Positively Mad participants (n=130) also demonstrated higher Attainment 8 Scores than their schools’ average scores, achieving on average +6.6 grades higher. Participants with medium prior attainment (n=70) demonstrated the greatest positive difference, achieving on average +5.5 grades higher across eight GCSEs than their classmates from the same attainment band.

Moving to Type 3 Evidence
Across the membership, we are critical about the methodological limitations of all our reporting. The analysis above uses the school average as a comparator group against which to compare the outcomes of activity participants. For this reason, it can be considered strong Type 2: Empirical Evidence, according to the OfS Standards of Evidence. It fails to meet the Type 3: Causal Evidence standard due to the chosen comparator group. It is very possible that participants are not representative of their classmates; the targeting inherent in outreach often drives this.
We have published a resource pack (members only) giving advice on sourcing and analysing data for a more suitable comparator group, based on experimental or quasi-experimental techniques. Following this, HEAT’s dashboards can now provide you with reporting, for this comparator group alongside your participants. Depending on the similarity of your comparator group to your participant group, this is a way to raise the evidence generated from HEAT’s Track reporting from a Type 2 to a Type 3.
Uni Connect Partnerships may be in a better position than some of HEAT’s Core members when it comes to sourcing data for a comparator group. Many partnerships have been baselining, and tracking, all pupils within year groups as part of CfE’s national evaluation. Make Happen were well organised in this regard and have been tracking all baseline respondents through HEAT.
Of the tracked baseline respondents, evaluators were able to isolate those who had not taken part in any outreach activities, other than completion of the baseline. This process identified 735 students who would make up a ‘non-treatment’ group with which to compare the outcomes of our treatment group of activity participants. Note: It is also important to consider how the participants have been selected and conversely why the non-participants were not selected. The reasons for this will determine how similar the two groups are in terms of their motivation to participate in outreach. This motivation is something that is more difficult to account for retrospectively, and thus ideally, should be considered during the evaluation design phase. Make Happen were confident that selection practices would not have resulted in large differences in motivation levels between the two groups.
Next, evaluators employed matching methods, based on a quasi-experimental research design, to match students retrospectively from treatment and non-treatment groups based on variables known to influence our outcome of interest: KS4 attainment. These variables were taken from a literature review of factors known to influence attainment (Sylva et al., 2014): Gender, Ethnicity, IMD and IDACI quintile and KS4 performance of school (quintiles calculated from HEAT’s Institution Profiles). Uni Connect Target ward (Y/N) was also included as a match variable to ensure the groups matched on this important variable to the programme.
Now for the technical bit, instructions for all of which are provided in our resource pack (members only). Participants were matched using Case Control Matching in SPSS v26 to a pair from the non-treatment group without replacing cases. A match tolerance of one quintile was allowed for IMD, IDACI and KS4 performance of school to maximise the number of matches. All other variables matched exactly. When conducting this type of matching, the match tolerance can be tightened or loosened; there will always be a trade-off between maximising the comparability of the groups and ensuring that a sufficient number of matches are made. Of the 165 Fix Up participants, a pair was found for 140 (85%). Of the 130 Positively Mad participants, a pair was found for 115 (88%). Unmatched records were discarded. The sample sizes are now slightly smaller but the groups were checked for balance post-matching and this ensured that the participant and non-participant groups were similar in relation to the observed variables to which we have access.
Matched non-participants were then registered to the same Activity records (one for Fix Up and one for Positively Mad) so that they were registered alongside participants. Unlike participants, however, the Evaluation Group for these non-participating students was set to ‘Comparison’. Coding the data in this way ensured that the KS4 attainment for these ‘Comparison’ students would be reported separately from ‘Participants’ in HEAT’s KS4 dashboard.
Results showed, broadly, the original findings remained true and participants’ Attainment 8 scores were higher than those from the matched comparator groups for both activities, albeit to a lesser extent than when the school average was used as the comparator. The smaller grade differences that we now observe between participants and the comparator group suggest that, in the case of these activities, using the school average as a comparator group may have led to an overestimation of the effect of the programmes. This is a good example of the need to collect data for a suitable comparator group that can be considered as similar as possible to the participant group.
Fix Up participants achieved an average of +1 grade higher than the matched non-participant group and Positively Mad participants achieved an average of +4 grades higher than the matched non-participant group. The Positively Mad result was statistically significant (p=.019). The Fix Up result was not significant at the 5% significance-level, likely due to the small observed effect size of 1 grade increase combined with the sample size available for analysis. This doesn’t necessarily mean we should write-off the result, and arguably we might expect to see only small gains in attainment from participating in outreach, but from these data we cannot be confident that the improvement in participants’ grades was due to the intervention, and may have been down to other factors as well as chance.
There were differences within prior attainment bands once the comparator group was changed. Fix Up participants with medium prior attainment no longer performed better than the comparator group, but those from low and high prior attainment bands did, albeit to a lesser extent than when compared with the school average scores. Participants with high prior attainment (n=45) achieved scores that were +3.5 grades higher than the match non-treatment group with similar prior attainment.

Positively Mad participants with low and medium prior attainment still performed better than non-participants from the same attainment bands, although again to a lesser extent than when the school average was used as a comparison group. Participants from the high prior attainment band (n=40) demonstrated the greatest improvement when compared with non-participants from the same attainment band, and the difference of +5 grades higher was greater than the difference calculated based on the school average comparison.
A final word, by way of a caveat. HEAT’s track reports provide one piece of evaluation, the findings from which should be triangulated with results from other sources. However, we do hope this process shows how NPD data can be accessed through HEAT in a meaningful and useful way and that this will now remove the need for HEAT members to submit resource intensive NPD applications of their own.
Crawford, C. (2014) The link between secondary school characteristics and university participation and outcomes, London: Department for Education.
Cummings, C., K. Laing, J. Law, J. McLaughlin, I. Papps, L. Todd and P. Woolner, P. (2012) Can Changing Aspirations and Attitudes Impact on Educational Attainment? A Review of Interventions, York: Joseph Rowntree Foundation.
Gorard, S. and B.H. See (2013) Overcoming Disadvantage in Education, Abingdon: Routledge
Sylva, K., Melhuish E., Sammons, P., Siraj, I., Taggart, B., Smees, R, Toth, K., Welcomme, W. and Hollingworth H. (2014) Students’ educational and developmental outcomes at age 16. Effective Pre-school, Primary and Secondary Education (EPPSE 3-16) Project. Research Report. Department for Education. Available at: https://assets.publishing.service.gov.uk/government/uploads/system/uploads/attachment_data/file/351496/RR354_-_Students__educational_and_developmental_outcomes_at_age_16.pdf