


- Research & Evidence
- HEAT Track Impact Reports
- HE Provider HEAT-HESA Track Impact Report
Key Findings


Students who took part in an intensive package of outreach consisting of at least eight contact hours are 12.5 percentage points more likely to enter higher education than a closely matched group of students who took part in less than three hours of outreach.*
In particular, further education students appear to benefit from participating in intensive outreach with those in receipt being more than 17 percentage points more likely to enter higher education than their peers in receipt of little to no outreach.
Once in higher education, outreach participants show similar continuation and degree attainment success rates to the national average.
* For the full definition of the different levels of outreach intensity used in this Report, please refer to the Methodology Section.
Introduction
On an annual basis, HEAT submits complete records for students who are expected to be ready to enter higher education (HE), and have given permission to be tracked, to the Higher Education Statistics Agency (HESA) for longitudinal tracking into the HE population. The latest HEAT-HESA Track dataset included students expected to enter HE in the 2021/22 academic year or earlier. This report presents the key findings from the latest HEAT-HESA Track dataset, in particular for students who have taken part in outreach activities recorded by HE providers on HEAT1.
By tracking learners who take part in outreach whilst at school or college, we can see whether they entered HE after 16-18 study. This informs our understanding of the contribution of outreach provision to attracting under-represented students into HE. Outreach provision is key to meeting the Office for Students’ (OfS) strategic objective, in particular regarding participation in HE: ‘All students, from all backgrounds, with the ability and desire to undertake higher education, are supported to access, succeed in, and progress from higher education’ (OfS, 2023a).
While the main focus of this report, and of widening participation work in general, is the Access stage of the student life cycle, the later stages of the student life cycle, Continuation and Degree Attainment are also explored. Tracking outreach recipients into the later student life cycle stages, such as Continuation and Degree Attainment, allows us to monitor their success once in HE, ensuring it is comparable with their peers.
This report is split into three sections presenting the latest findings on:
- Access to HE within two years of outreach participants expected to enter HE in 2020
- Continuation in HE of outreach participants who entered HE in 2021 on full-time first degrees
- Degree Attainment of outreach participants who completed their full-time first degrees in 2021
Each section compares outcomes for outreach participants recorded on HEAT with the national average for all comparable learners. To further examine the impact of participating in outreach on progression to HE, sections (1) and (2) also include a quasi-experimental approach using closely matched comparison groups.
A note on previous HE Provider HEAT-HESA Track Impact Reports, Footnotes and References are listed at the end of this page.
Methodology
We used a quasi-experimental approach comparing outcomes of a group of students who participated in an intensive package of outreach to a closely matched comparison group of students who participated in none to minimal outreach. An intensive package of outreach is defined as ‘11+ hours of any activity and eight or more hours of a high intensity activity content (Activity Types: Summer School, HE Subject Insight, Mentoring, Skills & Attainment, Campus Visit)’. To be classed as ‘a least intensive package of outreach’ (i.e., none to minimal outreach), a student has received a maximum of one activity with low intensity content (Activity Types: General HE Information, Exhibition) or less than three contact hours overall.2
Comparison groups were created individually for Access and Continuation measures and matching was conducted using case-control matching in SPSS. Matching variables were selected from the HEAT-HESA Track dataset based on:
- Research on factors impacting HE entry/continuation
- Student characteristics likely to be related to risks concerning equality of opportunity (informed by OfS, 2023b)
- Data availability3
It should be noted that the HEAT-HESA Track dataset is considered secondary data, i.e., this data has already been collected by the membership and additional data collection is not feasible. Therefore, key variables affecting HE progression such as student motivation and prior attainment4 could only be included using proxies. Due to the size of the membership and differences in targeting, delivery, and recording of student and activity data, other important factors, e.g., how students were targeted, could also not be taken into consideration.
Despite these limitations, the HEAT-HESA Track dataset provides the largest and most complete longitudinal tracking dataset of outreach participants available. The cohorts included in this analysis consist of over 190,000 students who have received outreach by HE providers within the HEAT community. Of all large outreach providers delivering Access interventions in England, 87% record their data on the HEAT system, enabling us to draw high-level trends about the efficacy of outreach delivery in England.
1. Access
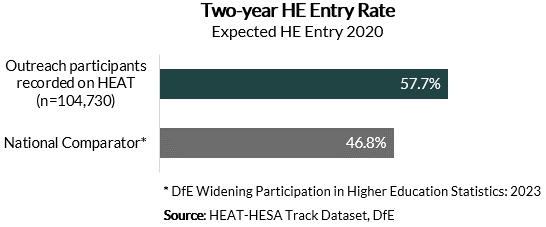
Of all outreach participants recorded on HEAT who were expected to enter HE in 2020, 57.7% were found in the HE population by 2021. At national level, only 46.8% of young people entered HE within two years of being expected to do so, according to the Department for Education’s (DfE) latest Widening Participation in Higher Education statistics (DfE, 2023) (Figure 1). The higher proportion of outreach participants entering HE suggests that being in receipt of outreach interventions may contribute towards students’ likelihood of accessing HE.
To explore the impact of participation in outreach on HE progression further, we next apply a quasi-experimental matched cohort design to investigate if there are statistically significant differences in HE entry when comparing a group of students who participated in an intensive package of outreach to a closely matched group of students who participated in little or no outreach.

Across all outreach participants included in the matched analysis, those in receipt of an intensive package of outreach entered HE at a rate of 71%, compared to only 58.5% of those in receipt of little or no outreach (Figure 2). The percentage point gap of 12.5 was found to be statistically significant and those engaged in intensive outreach were thus 1.2 times more likely to progress to HE within two years of being expected to enter.
Therefore, after controlling for factors known to affect progression to HE, rates of HE entry remain higher for students who have engaged in an intensive package of outreach when compared with those who have not. This allows us to be more confident in stating that the differences we observe can be attributed to outreach participation, rather than occurring as a result of other differences between the two groups.
The majority of the matched sample consisted of students who participated in outreach while at a secondary school. Among this group a particularly high HE entry rate of 72.9% was observed. The gap to a matched comparator group of school students who received little to no outreach was 11.3 percentage points, which was found to be statistically significant. This suggests that school students who engage in an intensive package of outreach have an increased likelihood of entering HE.
A smaller subsection of the matched group consisted of students who participated in outreach while at a FE college5. Of those in receipt of an intensive package of outreach, 63% entered HE, compared to only 45.5% of those in receipt of little to no outreach. The large gap between entry rates of FE students who participated in an intensive package of outreach to those who did not was found to be statistically significant and those in receipt of an intensive package of outreach in this subgroup were therefore 1.4 times more likely to enter HE than their counterparts in receipt of little to no outreach. This gap suggests that FE students may particularly benefit from participation in an intensive package of outreach.
It should be noted that the proportion of FE learners in the matched cohort is smaller than the proportion of learners who only participated while in secondary school or sixth form. FE learners may have had less time and opportunity to participate in outreach, in particular if only participating while at a FE college, which means they may be less likely to meet the threshold for an intensive package of outreach resulting in a smaller sample size for this analysis.
2. Continuation
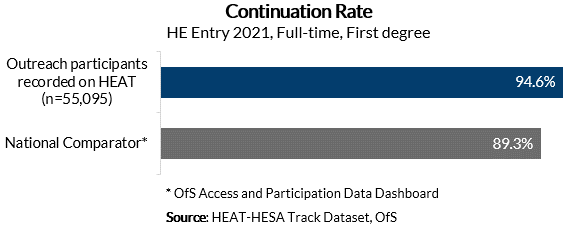
Of all outreach participants tracked by HEAT who entered HE on full-time first degrees in 2020, 94.6% continued in HE after the first year, compared to 89.3% across all registered English HE providers according to the OfS’ Access and Participation Data Dashboard (OfS, 2023c) (Figure 3).
Once on course, outreach participants continue at a similar rate to the national average. The slightly higher proportion of outreach participants continuing in HE may tentatively suggest that being in receipt of an outreach intervention may not only increase access to HE but also provide encouraging support to students to improve their likelihood to continue in HE.
To explore the impact of participation in outreach on students’ continuation in HE further, we next apply a quasi-experimental matched cohort design to explore if there are statistically significant differences when comparing a group of students who participated in an intensive package of outreach to a closely matched group of students who participated in little or no outreach.
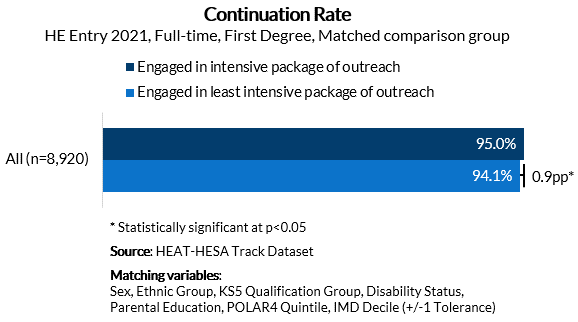
Across all outreach participants included in the matched analysis, those in receipt of an intensive package of outreach continued in HE at rate of 95%, compared to 94.1% of those in receipt of little or no outreach (Figure 4). A small, yet statistically significant, gap of 0.9 percentage points was observed.
While the participation in outreach in general appears to have a positive effect on the continuation in HE, the different levels of intensity of the package of outreach observed by a matched comparison group do not currently show a large effect on non-continuation.
It should be kept in mind that outreach activities are generally intended to ultimately increase Access to HE; however, one may argue that students making more informed decisions regarding going to HE, and having a better idea of what it is like to study in HE, may also positively impact whether they stay in HE after the first year. While improved continuation may be a byproduct of outreach activities, there are many other factors impacting on student continuation and underlying mechanisms have not been explored further for the purpose of this report.
3. Degree Attainment
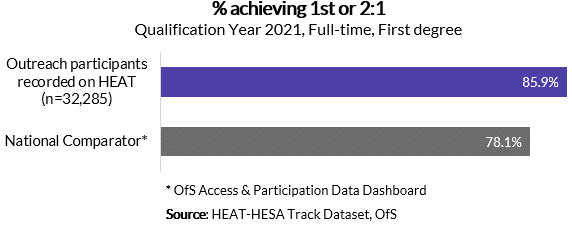
Of all outreach participants tracked by HEAT who qualified for a full-time first degree in 2021, 85.9% achieved a First Class or Upper Second Class degree, compared to 78.1% across all registered English HE providers according to the OfS’ Access and Participation Data Dashboard (OfS, 2023c) (Figure 5). This suggests that outreach participants progress in HE similar to their peers.
It should be noted that Degree Attainment is not commonly an intended outcome of outreach interventions. Therefore, a matched comparison group design with groups in receipt of varying outreach packages was not applied. However, tracking outreach recipients into further student life cycle stages, such as continuation and degree attainment, allows us to monitor their success once in HE, ensuring it is comparable with their peers.
Copyright: Higher Education Statistics Agency Limited 2023. Neither the Higher Education Statistics Agency Limited nor HESA Services Limited can accept responsibility for any inferences or conclusions derived by third parties from data or other information supplied by the Higher Education Statistics Agency Limited or HESA Services Limited.
Previous versions of this report compared outcomes for outreach participants in the HEAT-HESA Tracked dataset to the OfS’ Key Performance Measures (KPM). Due to recent changes to the content and format of the KPMs, this is not possible anymore.
We now provide national comparison data sourced from a set of statistics which is published annually by the DfE and from the OfS’ Access and Participation Data Dashboard, in-line with the national comparator data we provide in the HEAT member-level HESA Track Power BI dashboards. Calculations of any metrics used in this report have been aligned as much as possible. For these reasons, any outcomes reported on in this report cannot be compared to previous versions.
1. Activities and students recorded by HEAT members who are not HE providers (i.e., Uni Connect Partnerships and third sector organisations) are not included in this report. A HEAT-HESA Track Impact Report specifically for students engaged in Uni Connect outreach is also available.
2. For more details, please refer to our paper on Classifying Packages of Outreach by their Levels of Intensity.
3. This analysis draws from student and activity data recorded on HEAT by a large number of HEAT members. Large datasets are more likely to feature gaps and inconsistencies in data collection as well as data entry errors. Students where key variables were not available are not included in this quasi-experimental design due to the matching process not being able to proof sufficient similarity between the groups where data is missing, unknown, or unreliable.
4. Prior attainment for the cohort included in this report will be made available to us as part of an upcoming KS4-KS5-HESA Linked Dataset and we intend to update the analysis in this report using individual-level attainment data for matching.
5. Students were classed as ‘FE’ if they participated in outreach while at a Further Education college.
Department for Education (2023) Widening participation in higher education: 2023. URL: https://www.gov.uk/government/statistics/widening-participation-in-higher-education-2023 (accessed 22/09/2023)
Office for Students (2023a) Our Strategy. URL: https://www.officeforstudents.org.uk/about/our-strategy (accessed 22/09/2023)
Office for Students (2023b) Equality of Opportunity Risk Register. URL: https://www.officeforstudents.org.uk/advice-and-guidance/promoting-equal-opportunities/equality-of-opportunity-risk-register/ (accessed 22/09/2023)
Office for Students (2023c) Access and participation data dashboard. URL: https://www.officeforstudents.org.uk/data-and-analysis/access-and-participation-data-dashboard/data-dashboard/ (accessed 22/09/2023)
You may also like
HEAT-Key Stage 4 Track Impact Report
Learn more about the effect of outreach delivered by HEAT members on exam results at Key Stage 4 (GCSE).
Uni Connect HEAT-HESA Track Impact Report
Learn more about the outreach engagement recorded by HEAT Uni Connect members, and the impact of Uni Connect on Higher Education Progression.