
Anna Anthony, Senior Analyst
As you will all know, at HEAT we don’t only track students in to HESA to learn their HE progression outcomes, but also the National Pupil Database (NPD, to obtain Key Stage 4 (GCSE) and Key Stage 5 (A-level/BTEC) exam outcomes.
In December 2019, nearly all HEAT members received a membership-level report showing the Key Stage 4 (KS4) exam performance of all participants who engaged in outreach before sitting their GCSE exams. Just in case this has been missed, members can access their group’s Key Stage 4 report![]() in the File Store and the accompanying video guide explaining how to interpret your report
in the File Store and the accompanying video guide explaining how to interpret your report![]() .
.
Key Stage 4 attainment has been shown as critical to future HE progression. National research shows that attainment at this point explains nearly all of the social stratification in later HE progression (Crawford, 2014). Owing to this finding, the Office for Students now require universities to provide evidence in their Access and Participation Plans![]() of how they are raising pre-entry attainment in schools.
of how they are raising pre-entry attainment in schools.
HEAT’s aggregate report![]() showed a correlation between participation in a Uni Connect activity and improved attainment at KS4 when compared with school average results. This remained true after controlling for prior attainment at Key Stage 2 (exams taken at the end of primary school). Although this is a promising overall finding, to enhance learning about what boosts attainment, we also need to support members wishing to evaluate specific activities using these data.
showed a correlation between participation in a Uni Connect activity and improved attainment at KS4 when compared with school average results. This remained true after controlling for prior attainment at Key Stage 2 (exams taken at the end of primary school). Although this is a promising overall finding, to enhance learning about what boosts attainment, we also need to support members wishing to evaluate specific activities using these data.
To achieve this HEAT have offered to re-run each member’s most recent reports based on a cohort of participants of their choice. HEAT’s membership-level reports![]() are based on all participants an institution group has recorded on HEAT, and so may include participants who have taken part in only minimal outreach, perhaps students who have only completed a baseline survey. Reporting on all participants can have the effect of including a lot of ‘noise’ in the results, which may render them less useful for partnerships’ evaluation.
are based on all participants an institution group has recorded on HEAT, and so may include participants who have taken part in only minimal outreach, perhaps students who have only completed a baseline survey. Reporting on all participants can have the effect of including a lot of ‘noise’ in the results, which may render them less useful for partnerships’ evaluation.
A practical example
To demonstrate the potential evidence that it is possible to generate from our offer to re-run reports based on a sub-set of participants, we have teamed up with the Uni Connect Partnership Make Happen to work through a real example. The process is possible for any HEAT member with participant data in the latest KS4 tracking report.
Make Happen were keen to understand whether two of their pre-16 activities had an impact on participants’ KS4 exam attainment. These activities were run in partnership with two external providers. First, Fix Up who offer a range of sessions related to providing support with motivation and exam preparation. Second, Positively Mad who run whole day workshops in schools focused on exam and revision skills.
Drawing on HEAT’s offer to re-run KS4 reports, Make Happen identified the participants they wanted to include in two separate KS4 attainment reports, one for each activity. Make Happen were careful to include only those participants who had attended and received above a threshold contact hours of two and three hours for each activity respectively.
Although both activities have an attainment-raising component, they were not tutoring activities. We are aware that there is still work to be done around setting out clear Theories of Change in relation to raising attainment, not least because the link between raising motivation and attainment is debated (Cummings et al., 2012; Gorard and See, 2013). We plan to pick this up when we promote the use of HEAT’s Evaluation Planning Tool![]() later in the year. It is my intention to collaborate with members on developing and testing Theories of Change as recommended in the OfS report: Evaluation of outreach interventions for under 16 year olds
later in the year. It is my intention to collaborate with members on developing and testing Theories of Change as recommended in the OfS report: Evaluation of outreach interventions for under 16 year olds![]() . But for now we feel confident that the activities in question provided a theoretically sound mechanism to improve participants’ attainment.
. But for now we feel confident that the activities in question provided a theoretically sound mechanism to improve participants’ attainment.
The results showed that, for Fix Up participants (n=165) Attainment 8 Scores were on average +6.1 grades higher than the average scores for the schools they came from. This remained true after breaking down by prior attainment at Key Stage 2: participants with low prior attainment (n=20) demonstrated the greatest positive difference, achieving on average +5.7 grades higher across eight GCSEs than their similarly low attaining classmates.
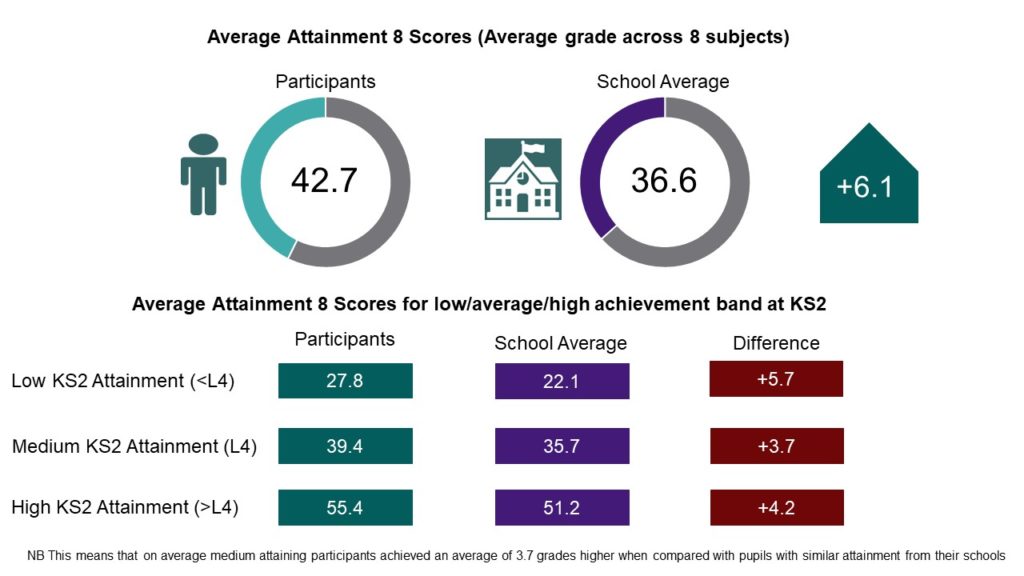
Fix Up Participants’ Attainment 8 Scores compared with the School Average
Positively Mad participants (n=130) also demonstrated higher Attainment 8 Scores than their schools’ average scores, achieving on average +6.6 grades higher. Participants with medium prior attainment (n=70) demonstrated the greatest positive difference, achieving on average +5.5 grades higher across eight GCSEs than their classmates from the same attainment band.
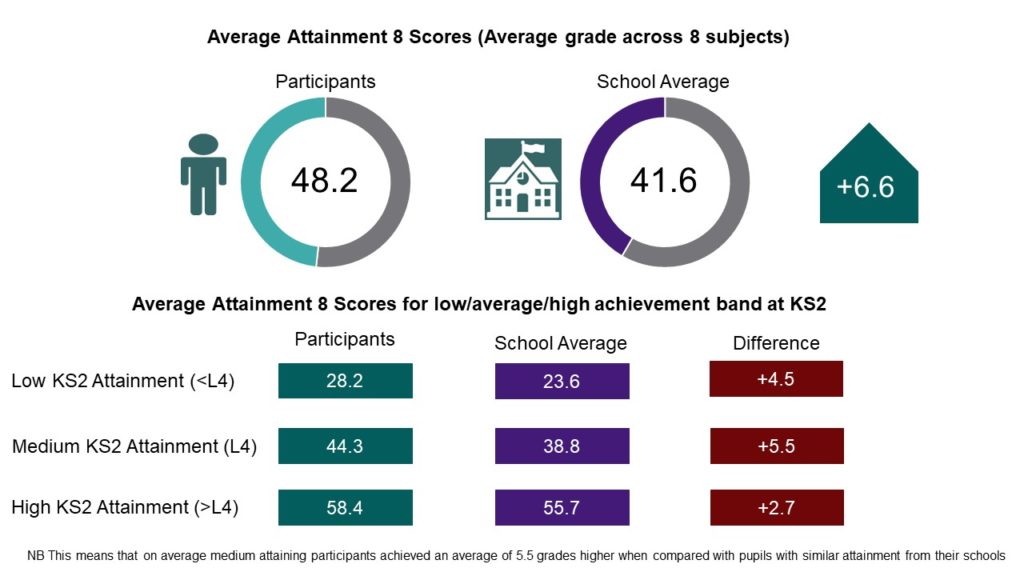
Positively Mad Participants’ Attainment 8 Scores compared with the School Average
Moving to Type 3 evidence
At HEAT we are critical about the methodological limitations of all our reporting. The analysis above uses the school average as a comparator group against which to compare the outcomes of activity participants. For this reason it can be considered strong Type 2: Empirical Evidence, according to the OfS Standards of Evidence![]() . It fails to meet the Type 3: Causal Evidence standard due to the chosen comparator group. It is very possible that participants are not representative of their classmates; the targeting inherent in WP often drives this.
. It fails to meet the Type 3: Causal Evidence standard due to the chosen comparator group. It is very possible that participants are not representative of their classmates; the targeting inherent in WP often drives this.
We have recently published a video giving advice on sourcing data for a more suitable comparator group![]() , based on experimental or quasi-experimental techniques. Following this, HEAT can provide you with reporting, using the same KS4 Track report template, for this comparator group alongside your participants. Depending on the similarity of your comparator group to your participant group, this is a way to raise the evidence generated from HEAT’s Track reporting from a Type 2 to a Type 3.
, based on experimental or quasi-experimental techniques. Following this, HEAT can provide you with reporting, using the same KS4 Track report template, for this comparator group alongside your participants. Depending on the similarity of your comparator group to your participant group, this is a way to raise the evidence generated from HEAT’s Track reporting from a Type 2 to a Type 3.
Uni Connect Partnerships may be in a better position than some of HEAT’s core members when it comes to sourcing data for a comparator group. Many partnerships have been baselining, and tracking, all pupils within year groups as part of CfE’s national evaluation. Make Happen were well organised in this regard and have been tracking all baseline respondents through HEAT. These students were linked to a ‘baseline survey’ activity and so were actually included in Make Happen’s original KS4 Track report from HEAT, an example of some of the ‘noise’ resulting from reporting on all activity participants found on the database.
Of the tracked baseline respondents, we were able to isolate those who had not taken part in any outreach activities, other than completion of the baseline. We identified 735 students who would make up a ‘non-treatment’ group with which to compare the outcomes of our treatment group of activity participants. Note: It is also important to consider how the participants have been selected and conversely why the non-participants were not selected. The reasons for this will determine how similar the two groups are in terms of their motivation to participate in outreach. This motivation is something that is more difficult to account for retrospectively, and thus ideally, should be considered during the evaluation design phase. Make Happen were confident that selection practices would not have resulted in large differences in motivation levels between the two groups.
Next we employed matching methods, based on a quasi-experimental research design, to match students retrospectively from treatment and non-treatment groups based on variables known to influence our outcome of interest: KS4 attainment. These variables were taken from a literature review of factors known to influence attainment (Sylva et al., 2014): Gender, Ethnicity, IMD and IDACI quintile and KS4 performance of school (quintiles calculated from HEAT’s Planning Datasets![]() ). Uni Connect Target ward (Y/N) was also included as a match variable to ensure the groups matched on this important variable to the programme.
). Uni Connect Target ward (Y/N) was also included as a match variable to ensure the groups matched on this important variable to the programme.
Now for the technical bit. Participants were matched using Case Control Matching in SPSS v26 to a pair from the non-treatment group without replacing cases. A match tolerance of one quintile was allowed for IMD, IDACI and KS4 performance of school to maximise the number of matches. All other variables matched exactly. When conducting this type of matching, the match tolerance can be tightened or loosened; there will always be a trade-off between maximising the comparability of the groups and ensuring that a sufficient number of matches are made. Of the 165 Fix Up participants, a pair was found for 140 (85%). Of the 130 Positively Mad participants, a pair was found for 115 (88%). Unmatched records were discarded. The sample sizes are now slightly smaller but the groups were checked for balance post-matching and this ensured that the participant and non-participant groups were similar in relation to the observed variables to which we have access.
We found that, broadly, our original findings remained true and participants’ Attainment 8 scores were higher than those from the matched comparator groups for both activities, albeit to a lesser extent than when the school average was used as the comparator. The smaller grade differences that we now observe between participants and the comparator group suggest that, in the case of these activities, using the school average as a comparator group may have led to an overestimation of the effect of the programmes. This is a good example of the need to collect data for a suitable comparator group that can be considered as similar as possible to the participant group.
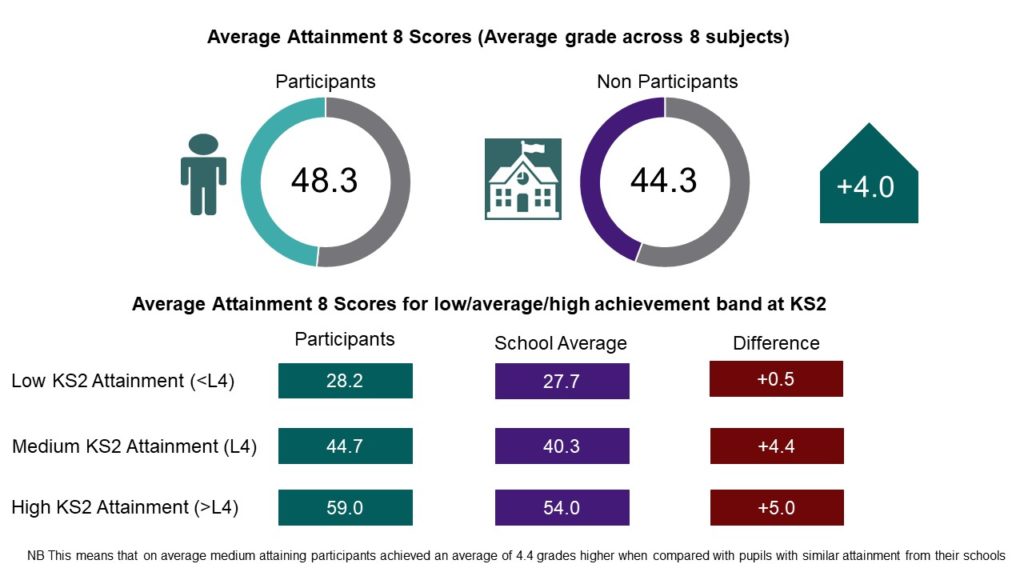
Fix Up participants achieved an average of +1 grade higher than the matched non-participant group and Positively Mad participants achieved an average of +4 grades higher than the matched non-participant group. The Positively Mad result was statistically significant (p=.019). The Fix Up result was not significant at the 5% significance-level, likely due to the small observed effect size of 1 grade increase combined with the sample size available for analysis. This doesn’t necessarily mean we should write-off the result, and arguably we might expect to see only small gains in attainment from participating in outreach, but from these data we cannot be confident that the improvement in participants’ grades was due to the intervention, and may have been down to other factors as well as chance.
There were differences within prior attainment bands once we changed the comparator group. Fix Up participants with medium prior attainment no longer performed better than the comparator group, but those from low and high prior attainment bands did, albeit to a lesser extent than when compared with the school average scores. Participants with high prior attainment (n=45) achieved scores that were +3.5 grades higher than the match non-treatment group with similar prior attainment.

Fix Up Participants’ Attainment 8 Scores compared with the Non-Participants’ Scores
Positively Mad participants with low and medium prior attainment still performed better than non-participants from the same attainment bands, although again to a lesser extent than when the school average was used as a comparison group. Participants from the high prior attainment band (n=40) demonstrated the greatest improvement when compared with non-participants from the same attainment band, and the difference of +5 grades higher was greater than the difference calculated based on the school average comparison.
Positively Mad Participants’ Attainment 8 Scores compared with the Non-Participants’ Scores
One limitation of the design must be noted. We were not able to include prior attainment at KS2 as a matching variable as this is not available to HEAT members at student-level. It is available to me as HEAT Analyst, but I wanted to follow the process that we are offering members, using the data available to you. We are trying to find a solution to this that would allow prior attainment to be included in the matching variables whilst complying with the DfE’s data sharing requirements, but for now this is not possible. However, this may not weaken the evaluation too dramatically as we are able to provide breakdowns by prior attainment band in the report. We are also able to present a profile of KS2 prior attainment bands in the generated reports after matching. Fortunately, the KS2 band profiles were very similar for participant and non-participant groups in both activities.
It may be possible to strengthen the design described above by improving the variables used in the matching process. HEAT’s improved Survey Tool (Technical Update 14![]() ) means the database can now accommodate the responses to surveys, including the CfE baseline survey. It may then be possible to include an indicator for educational engagement in the matching, taken from attitudinal questions.
) means the database can now accommodate the responses to surveys, including the CfE baseline survey. It may then be possible to include an indicator for educational engagement in the matching, taken from attitudinal questions.
Until then, we are pleased with the design of the evaluation and the results we were able to produce. All of this has been possible using HEAT’s exports and standard KS4 reporting. The KS4 attainment data on which these reports are based are sourced from the NPD following a lengthy and resource intensive negotiation process with the DfE. It is therefore important that the use of these data are optimized by HEAT members. I would encourage all partnerships to engage with these data.
How can I get results for my activities?
Start by looking up your KS4 report and read the accompanying Notes document to find out how to request the Student HEAT IDs making up the report. Using these IDs alongside exports from HEAT you can append the activities in which these students have participated, and explore whether you can follow the process described here.
A final word, by way of a caveat. HEAT’s track reports provide one piece of evaluation, the findings from which should be triangulated with results from other sources. However, I do hope this process shows how NPD data can be accessed through HEAT in a meaningful and useful way and that this will now remove the need for HEAT members to submit resource intensive NPD applications of their own.
I look forward to receiving lots of requests for more KS4 Track reports from you all! Please contact us at support@heat.ac.uk or me directly at anna.anthony@heat.ac.uk if you would like to discuss how you might go about optimizing the use of HEAT’s tracking data for your own evaluation.